Social Listening Performance view
The following permissions:
- All Permissions under socialmedia > postAggregate
- socialmedia > postAggregate – View
- All Permissions under socialmedia > postDetail
- socialmedia > postDetail – View
- All Permissions under socialmedia > contentModerationCategory (admins to assign all content moderation category permissions, including any future permissions)
- socialmedia > contentModerationCategory – Edit (admins to edit a Content Moderation Category)
- socialmedia > contentModerationCategory – View (admins to view Content Moderation Category)
- socialmedia > message – edit post attributes (users to change a post moderation flag between SFW or NSFW)
- socialmedia > topic – View
The Social Listening Performance view page is the central location for viewing more information about social listening data. The data is automatically populated based on the data ingestion rules created by the admins. This page provides a visual representation of the data ingestion data in the following categories:
- Mentions Over Time Breakdown by Topic – Displays the topic-wise social statistics for the keywords added in the data ingestions rule over a specific period. By default, the data is displayed as a line chart. You can change the chart type to a pie chart and see the standard deviation. Note: The chart displays only the top 10 topics, ordered by usage in descending order, even if you select up to 50 topics.
- Unique Users by Topic – Displays the number of unique users over a specific period based on the topic. By default, the data is displayed as a line chart. You can change the chart type to a pie or bar chart and see the standard deviation. Note: The chart displays only the top 10 topics, ordered by usage in descending order, even if you select up to 50 topics.
- Net Sentiment Over Time – Displays the net sentiment percentage data over a specific period based on the topic. By default, the data is displayed as a line chart. You can see the standard deviation. The net sentiment is calculated by: ((Total Positive Posts – Total negative posts)/(Total Positive + Total Negative + Total Neutral posts)) * 100
- Sentiment Breakdown by Topic – Displays the topic-wise sentiment data such as Positive, Negative, Neutral, and Unknown. By default, the data is displayed as a bar chart. Note: The chart displays only the top 10 topics, ordered by usage in descending order, even if you select up to 50 topics.
- Sentiment Breakdown by Platform – Displays the platform-wise sentiment data percentage. By default, the data is displayed as a bar chart.
- Mentions Breakdown by Platform – Displays the platform-wise social listening data. By default, the data is displayed as a bar chart. You can change the chart type to a pie chart. By default, the data is displayed as a bar chart.
- Mentions Breakdown by Topic and Platform – Displays the topic-wise and platform-wise social listening data. Note: The chart displays only the top 10 topics, ordered by usage in descending order, even if you select up to 50 topics.
- Content Type Breakdown by Platform – Displays the platform-wise content type data, including Text, Image, and Video. By default, the data is displayed as a pie chart.
To see social listening data and metrics, click Performance > Workspace > Social > Social Listening Performance.
To see social listening data and metrics, perform the following:
- Click Menu > Analytics > Analytics Workspace.
- In the Default section, search for Social Listening Performance and then click the view name to open it.
In all the chart types, you can right-click on the respective data point to view the drill-down information of that point along with the filters and the duration.
Set a default time zone in the workspace
You can set the default time zone in the analytics workspace before viewing any analytics view.
To set the default time zone in the workspace, follow these steps:
- Click Performance > Workspace.
- Click Menu > Analytics > Analytics Workspace.
- On the left side, from the Time zone drop-down menu, select the required time zone as the default time zone for the analytics workspace.
To save the view with your filter, click Save View .
This view updates automatically except when you use filters from the Filters pane. To see the most current data, click Refresh .
Customize the view
To show only certain data, customize the Social Listening Performance view using any combination of filters. For example, you can choose to show only certain filters to see certain types of data. You can also save your filter and column settings as a saved view to switch quickly between different data of interest in the same view.
Change chart type
You can change the chart type only for the following categories:
- Mentions Over Time Breakdown by Topic
- Unique Users by Topic
- Mentions Breakdown by Platform
To change the chart type:
- In the upper right corner of the required category, click More.
- Click the required chart type such as View as pie chart, View as line chart, or View as bar chart. Note: The View as a bar chart option is available only for the Unique Users by Topic category.
View Standard Deviation
You can view standard deviation data only for the following categories:
- Mentions Over Time Breakdown by Topic
- Unique Users by Topic
- Net Sentiment Over Time
To view/hide the standard deviation:
- In the upper right corner of the required category, click More.
- Click View Standard Deviation.
To customize analytics views, use the preset date ranges.
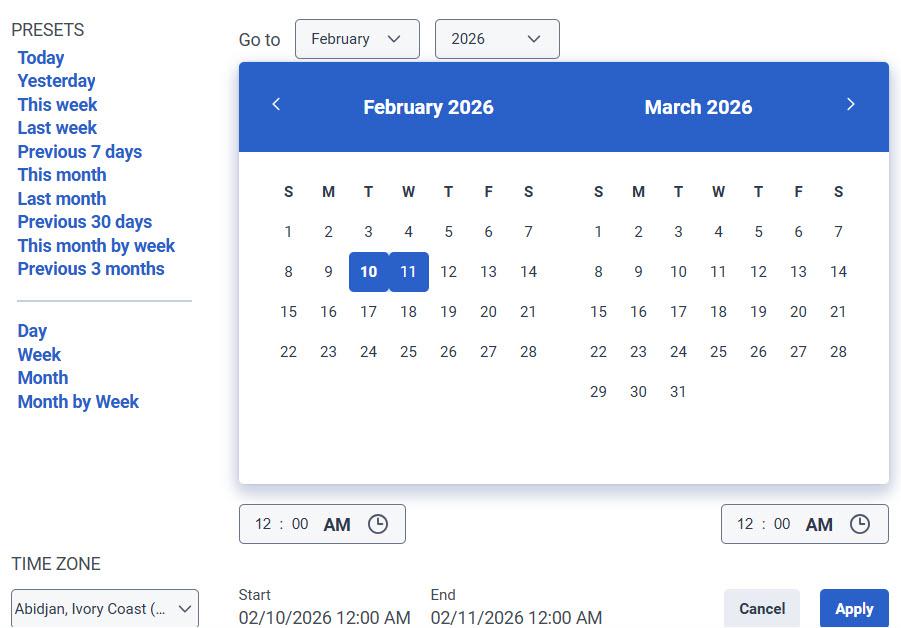
To filter metrics by date or configure a custom date range, use presets. When filtering metrics for this view, select any custom date range up to 6 weeks.
To use a preset to filter metrics, complete the following steps:
- To display the date filter, click the date.
- In the Presets list, select a preset date option.
Date presets
| Presets | Description |
|---|---|
| Today | Shows data for the current day. |
| Yesterday | Shows data for the previous day. |
| This week | Shows data for the current week, that is, Sunday through Saturday. |
| Last week | Shows data for the previous week, Sunday through Saturday. |
| Previous 7 days | Shows data for the previous seven days. |
| This month | Shows data for the current month, with no extra days. |
| Last month | Shows data for the previous calendar month with no extra days. |
| Previous 30 days | Shows data for the previous 30 days. |
| This month by week | Shows data for the current calendar month starting on Sunday and ending on Saturday, including extra days if the month does not start on Sunday or end on Saturday. |
| Previous 3 months | Shows data for the previous 3 months. For example, Nov 1, 2022 – Jan 31, 2023. |
| Day | Shows data for a single 24-hour day. |
| Week | Shows data for a Sunday through Saturday time period. |
| Month | Shows data for the exact month with no extra days. If the current month is selected, you can see the data up to the current date. |
| Month by Week | Shows data for a calendar month starting on Sunday and ending on Saturday, including extra days if the month does not start on Sunday or end on Saturday. |
- To use a custom date range to filter metrics, complete the following steps:
- Click the date to display the date filter.
- Select a start date and an end date on the calendar.
- Click Apply.
- To view data for a different time period using the same date presets, click the arrows on either side of the date display. For example, to view data for the previous day, click the Day preset, and then click the arrow on the left side of the date.
To filter by information about the social listening data, click Toggle filters panel , and then search or scroll to select the filter you want to use.
Interactions filters
| Filter | Description |
|---|---|
| Topic | Choose the required topic from the list of topics created with different data ingestion rules. Note: You can select up to 50 topics. If you select more than 50 topics, an error message appears. |
| Ingestion Rule | Choose the required data ingestion rule. The data ingestion rule is displayed based on the topic selected. Note: You can select up to 50 data ingestion rules. If you select more than 50 rules, an error message appears. |
| Posts | Choose the required post type:
|
| Sentiment | Choose the required sentiment type:
|
| Content Safety |
Choose the required option:
|
| Platform | Choose the required platform:
|
| Country | Choose the required country. |
| Language | Choose the required language from the list of supported languages. Note: As the language detection accuracy for smaller posts (fewer than five words) is low, Genesys Cloud skips the language detection algorithm for the smaller posts and marks the language as Unknown. |
| Words or Phrases | Displays posts that contain specific words or phrases. Filter for specific words or phrases that includes or excludes certain words or phrases. Select the word or words that you want. Filter for multiple words by entering more words and searching again. You can select the preferred words or phrases and filter the data based on the selected words or phrases. By default, the Includes option is enabled. You can select single or multiple words or phrases in the same level and view the filtered results. The words within the same level are combined using the OR operator. You can use the +AND with words or phrases option to add another level of words or phrases that must be AND’d together. This option allows you to perform layering analysis on the posts. |
| Content Type |
|
| Follower Count | Displays posts based on the number of followers of the author who created the post or comment. Specify a minimum and maximum follower count to include posts from accounts within a selected audience size or influence range, and then click Apply. Note: This filter is available only for the X platform. This filter appears when no platform is selected or when X is included in the selected platforms. |
| Verification Status | Displays posts based on whether the author’s social media account is verified or not verified. Use this filter to focus on posts from verified public figures, organizations, or brands, or to analyze content from non-verified accounts.
Note: This filter is available only for the X platform. This filter appears when no platform is selected or when X is included in the selected platforms. |
| Ratings | Choose one or more star ratings to display only Google Business Profile reviews with the selected rating values. You can filter reviews from one to five stars. Note: This filter is available only for the Google Business Profile platform. The filter is displayed when no platform is selected or when Google Business Profile is included in the selected platforms. |
[NEXT] Was this article helpful?
Get user feedback about articles.