Genesys Agent Copilot performance dashboard
To collect analytics for the dashboard from agents:
- Conversation > Suggestion Engagement – Add
- Knowledge > Document content copy – Add
- Knowledge > Document view – Add
- Knowledge > Feedback – Create
- Knowledge > Feedback – View
- Knowledge > Search – Edit
For analysts to view the dashboard:
- All permissions under Analytics > Tab configurations
- Analytics > Agent Copilot Aggregate – View
- Analytics > Conversation Aggregate – View
- Analytics > Knowledge Aggregate – View
- Analytics > Flow Observation – View
- Analytics > Summary Aggregate – View
- Analytics > Queue Observation – View
To use filters:
- Directory > User – View
- Routing > Queue – View
- Assistants > Queue – View
The Genesys Agent Copilot performance dashboard provides insights into Genesys Agent Copilot usage, including interaction activity, queue comparison, recommendations, summaries, and wrap-up codes performance.
Access the Genesys Agent Copilot performance dashboard
- Click Menu > Analytics > Analytics Workspace.
- In the Default section, search for Agent Copilot Performance and then click the view name to open it.
Genesys Agent Copilot performance dashboard overview
The dashboard provides insights into Agent Copilot’s performance and features.
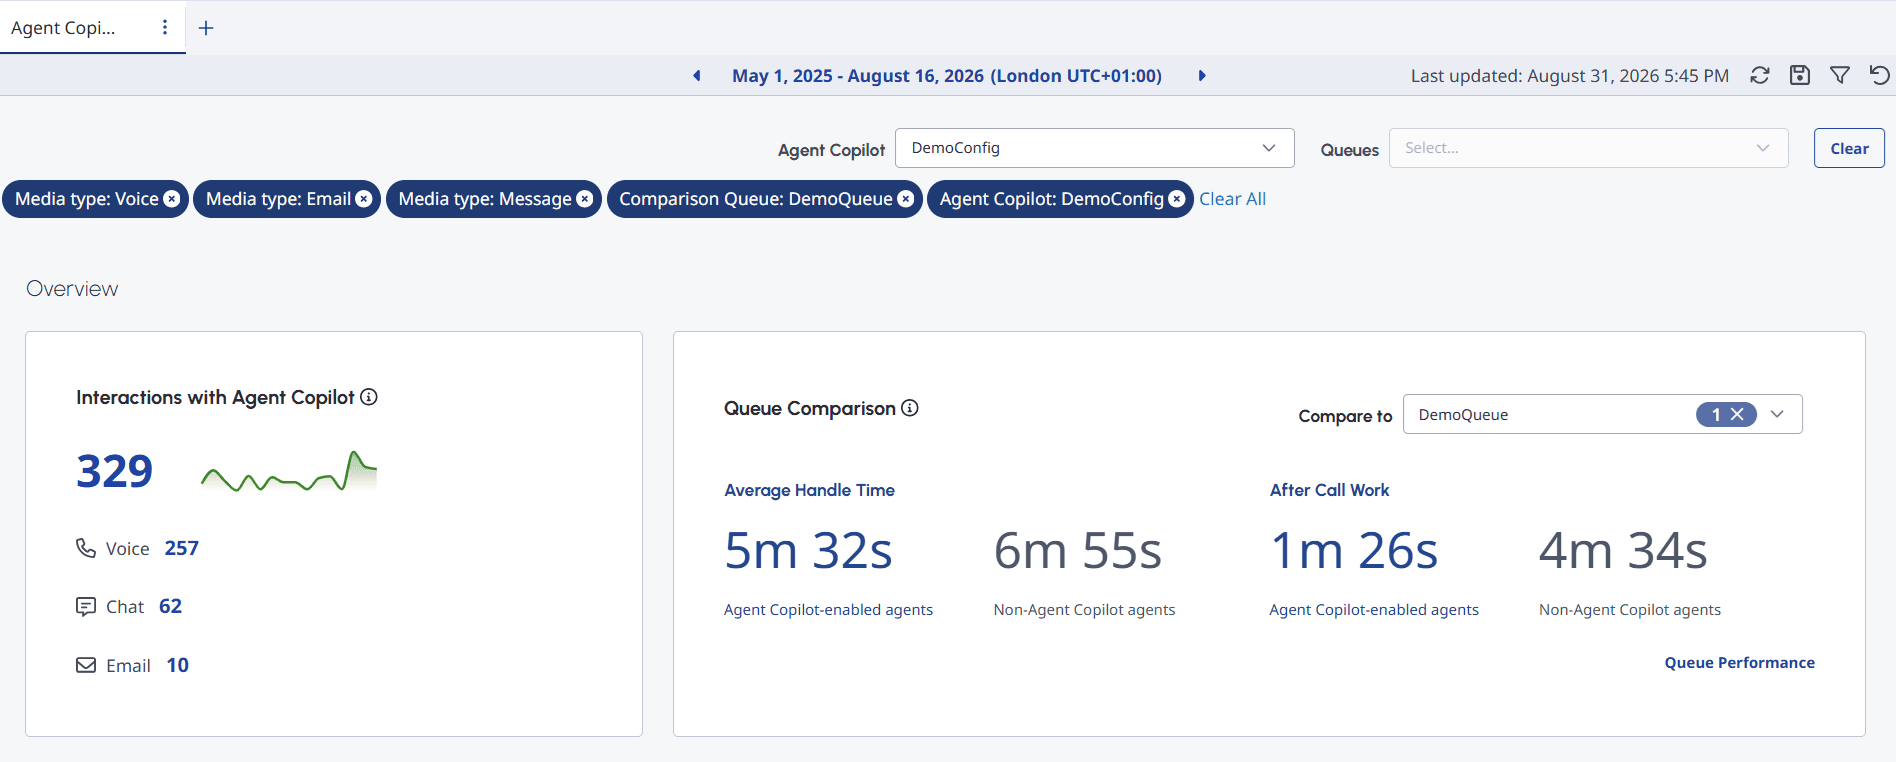
- To see the most current data, click Refresh .
- To save the view with your filter and column settings, click Save.
- To reset a view to default column settings, click Reset view to defaults .
The dashboard includes two main filters: Agent Copilot and Queues.
To view data in the dashboard, perform one of the following:
- From the Agent Copilot drop-down, select an Agent Copilot.
- From the Queues drop-down, select one or more queues.
The dashboard displays metrics for interactions associated with the selected Agent Copilot or queues. The dashboard displays metrics only for interactions handled by agents with Agent Copilot enabled. If no eligible interactions exist, the dashboard displays zero values.
Use the Queue Comparison widget to compare Average Handle Time (AHT) and After Call Work (ACW) metrics for Agent Copilot against one or more queues by selecting the desired queues from the Compare to list. You can compare multiple queues to analyze performance metrics and trends.
To customize analytics views, use the date filter.
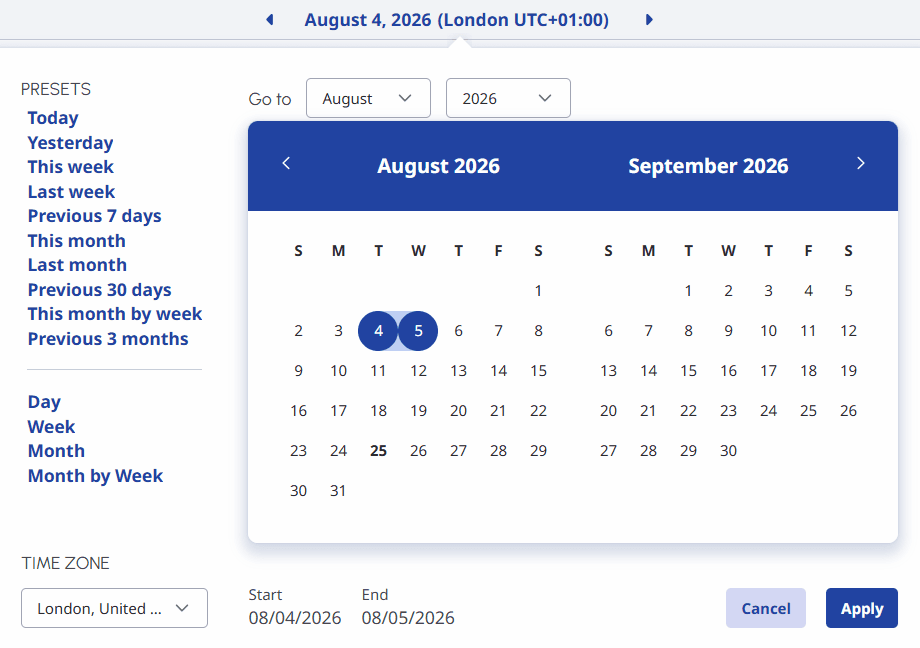
To filter metrics by date or configure a custom date range, use presets. When filtering metrics for this view, select any custom date range up to 6 weeks.
To use a preset to filter metrics, complete the following steps:
- To display the date filter, click the date.
- In the Presets list, select a preset date option.
Date presets
| Presets | Description |
|---|---|
| Today | Shows data for the time period that includes the current interval. |
| Yesterday | Shows data for the previous day. |
| This week | Shows data for a Sunday through Saturday time period. |
| Last week | Shows data for the previous week, Sunday through Saturday. |
| Previous 7 days | Shows data for the previous seven days. |
| This month | Shows data for the current month, with no extra days. |
| Last month | Shows data for the previous calendar month with no extra days. |
| Previous 30 days | Shows data for the previous 30 days. |
| This month by week | Shows data for the current calendar month starting on Sunday and ending on Saturday, including extra days if the month does not start on Sunday or end on Saturday. |
| Previous 3 months | Shows data for the previous 3 months. For example, Nov 1, 2022 – Jan 31, 2023. |
| Day | Shows data for a single 24-hour day. |
| Week | Shows data for a Sunday through Saturday time period. |
| Month | Shows data for the exact month with no extra days. If the current month is selected, you can see the data up to the current date. |
| Month by Week | Shows data for a calendar month starting on Sunday and ending on Saturday, including extra days if the month does not start on Sunday or end on Saturday. |
- To use a custom date range to filter metrics, complete the following steps:
- Click the date to display the date filter.
- Select a start date and an end date on the calendar.
- Click Apply.
- To view data for a different time period using the same date presets, click the arrows on either side of the date display. For example, to view data for the previous day, click the Day preset, and then click the arrow on the left side of the date.
- To view data for a different time zone using the same date presets, from the Time zone drop-down menu, select the required time zone. You can create and save reports with the same selected time zone.
When each row shows a day, click a row to view that day’s 30-minute intervals.
You can filter the information by media types and user types. The supported media types are voice, callback, chat, email, and message.
To filter the information by media type or users:
- Click Toggle filters panel .
- Search or scroll to select one or more of the following:
- Media type: Voice, Callback, Chat, Email, and Message.
- Include inactive users — To include inactive users in the list.
- Include deleted users — To include deleted users in the list.
- In the Select field, enter a user name and choose one or more users from the list.
The dashboard reflects the data based on one or more filters selected.
The Genesys Agent Copilot performance dashboard has three sections as follows:
- Overview
- Recommendations
- ACW
In this section, let us discuss them in detail.
Overview
The overview section provides insights about the following:
- Total number of interactions where Agent Copilot was used by agents.
- Comparison of Average Handle Time (AHT) and ACW between Agent Copilot-enabled agents and non-Agent Copilot agents across selected queues.
Interactions with Agent Copilot
The Interactions with Agent Copilot widget provides insights about the total number of interactions in the selected queue where agents used Agent Copilot.
Queue Comparison
The Queue Comparison widget provides insights into the comparison of AHT and ACW between Agent Copilots and queues. You can compare multiple queues to analyze performance metrics and trends. AHT is defined as the average time required to handle interactions. For more information, see average handle time. ACW is defined as the average time agents spent completing after-call work. For more information, see after call work.
You can perform the following types of comparisons:
- Agent Copilot vs. queues — Compare AHT and ACW metrics between Agent Copilot and queues without Agent Copilot enabled to evaluate Copilot effectiveness.
- Agents with and without Agent Copilot Enabled — Compare performance metrics for specific agents when using Agent Copilot versus when not using Agent Copilot.
- Between queues — Compare one or more queues against others to analyze performance differences and identify trends.
Recommendations
The recommendations section provides insights about the following:
- Total number of recommendations generated.
- Number of manual searches performed by agents.
- Detailed performance metrics for each content type.
- Insights about the AI-generated summaries and wrap-up codes.
Total Recommendations
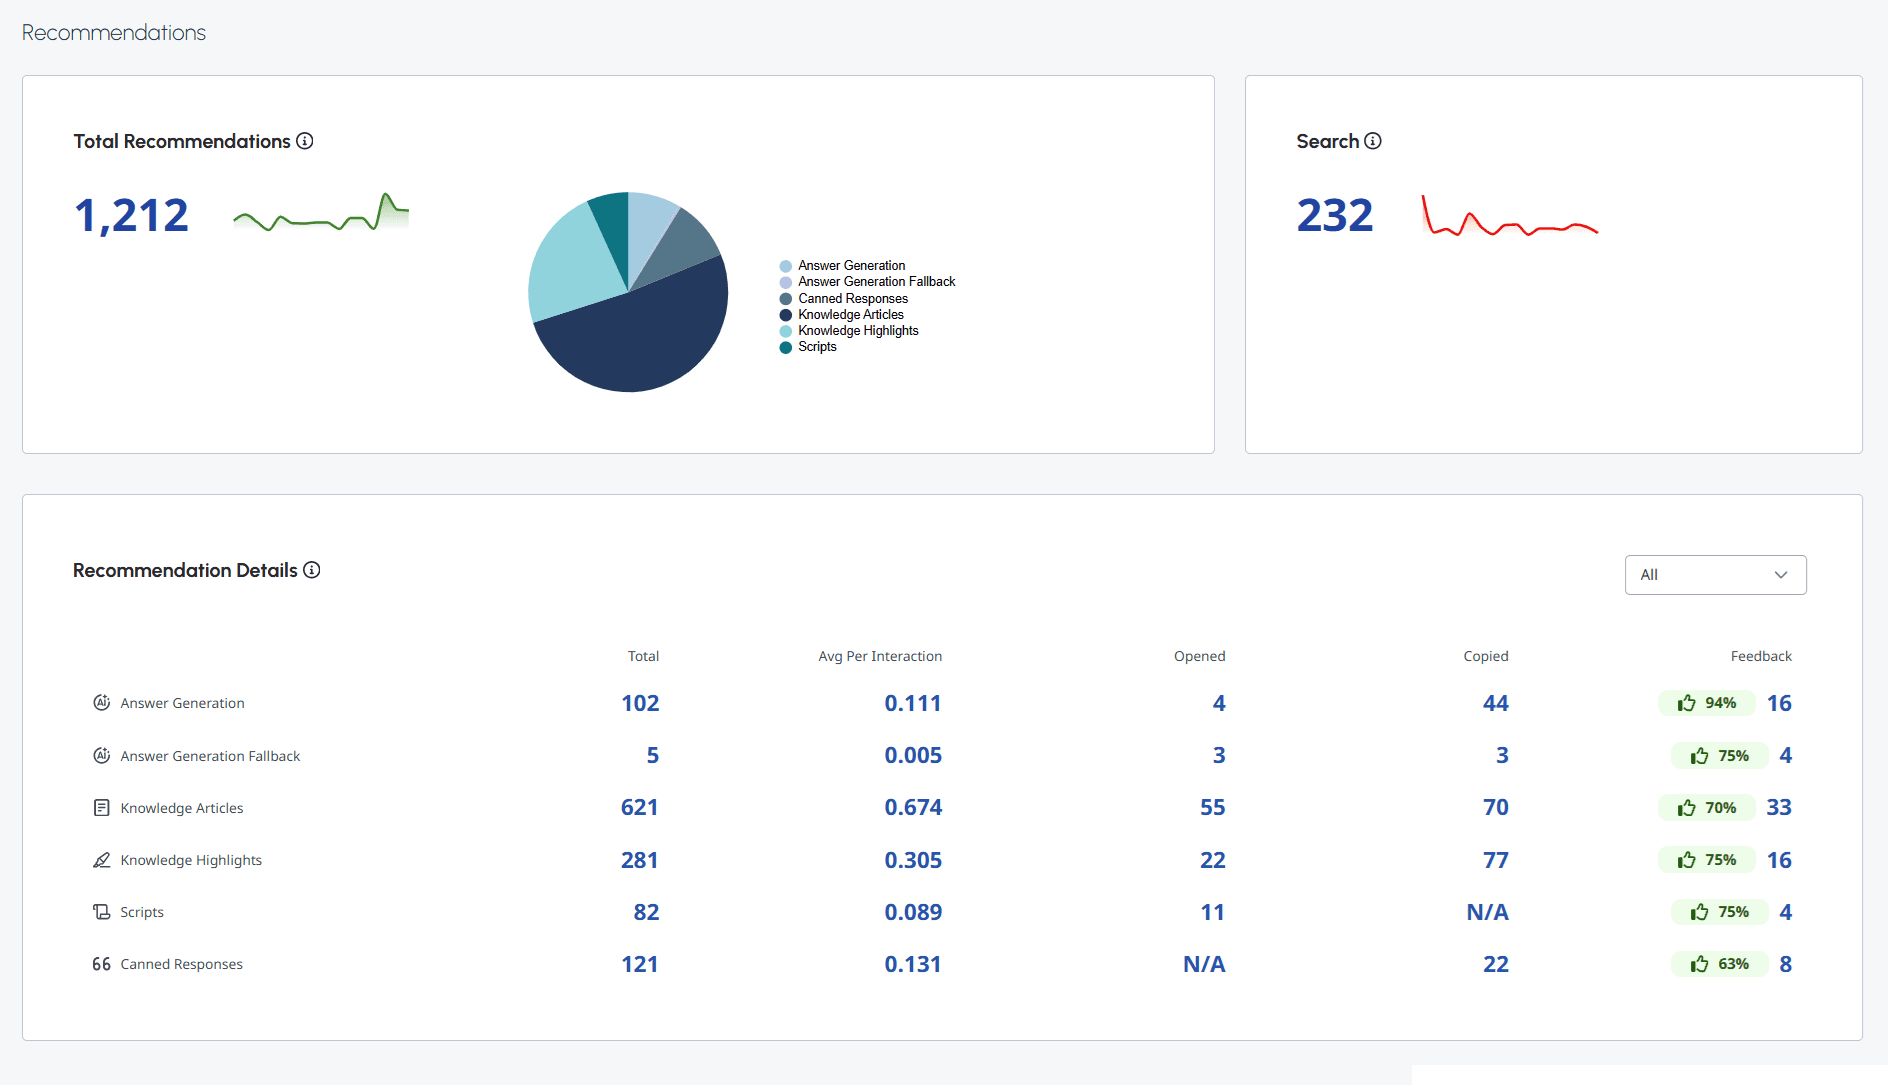
The Total Recommendations widget provides insights about the total number of recommendations that Agent Copilot presented to agents based on interaction context and queries, including a breakdown by content type.
The supported content types are:
- Answer Generation — Displays AI-generated answers that Agent Copilot surfaces to agents during an interaction.
- Answer Generation Fallback — Displays the most relevant knowledge search results when an AI-generated answer is unavailable, ensuring agents continue to have access to relevant information.
- Knowledge articles — Genesys Agent Copilot suggests a knowledge article without retrieval augmented generation.
- Knowledge highlights — Genesys Agent Copilot suggests a knowledge article with highlighted answers.
- Scripts — Genesys Agent Copilot suggests a script page for navigation.
- Canned responses — Genesys Agent Copilot suggests a predefined response.
Search
The Search widget provides insights about the number of manual searches performed by agents within Agent Copilot.
Recommendation Details
The Recommendation details view provides a detailed breakdown of content surfaced by Agent Copilot. You can filter the data by All, Knowledge search, and Rules engine.
The supported metrics per content type are:
- Total — Total number of recommendations for the content type.
- Avg per interaction — Average number of times the content type is recommended per interaction.
- Opened — Average number of times agents open the recommended content.
- Copied — Average number of times agents copy the content to a digital channel.
- Feedback — Total feedback provided and the positive feedback percentage.
Summaries
The summaries widget provides insights into the AI-generated summaries, including after call work, on-demand, and emails.
This section includes these insights:
| Metrics | Description |
|---|---|
| Generated | The number of successfully generated AI summaries with Agent Copilot. |
| Average Summary Generation Time | The average time taken for Agent Copilot to generate a summary. |
| Presented | The number of successful or unsuccessful AI-generated summaries, where agents viewed the summary, reason, or resolution fields. |
| Edited | The number of successful or unsuccessful AI-generated summaries, where agents edited the summary, reason, or resolution fields. |
| Copied | The number of successful or unsuccessful AI-generated summaries, where agents copied full or partial content of the summary, reason, or resolution fields. |
| Feedback | The number of successful AI-generated summaries that received agent feedback (positive or negative). |
| Failed to load – timeout | The number of successful or unsuccessful AI-generated summaries, where the generation time exceeds 40 seconds. |
| Failed to load – too long | The number of AI-generated summaries that failed due to long interactions. |
| Failed to load – too short | The number of AI-generated summaries that failed due to short interactions. |
| Failed to load – rate limited | The number of AI-generated summaries that failed due to rate limit constraints. |
| Failed to load – unknown | The number of AI-generated summaries that failed for unknown reasons. |
Wrap-up Codes
The Wrap-up Codes widget provides insights about the AI-suggested wrap-up codes.
This section includes these insights:
| Metrics | Description |
|---|---|
| Generated | The number of successful AI-generated summaries where at least one AI-suggested wrap-up code was generated. |
| Submitted | The number of successful AI-generated summaries where agents selected and submitted an AI-suggested wrap-up code. |
| Feedback | The number of successful AI-generated summaries where agents provided positive or negative feedback on AI-suggested wrap-up codes. |
| Failed to generate | The number of successful or unsuccessful AI-generated summaries where AI-suggested wrap-up codes were not generated. |
| Failed to load – timeout | The number of successful or unsuccessful AI-generated summaries where the generation time exceeds 40 seconds. |
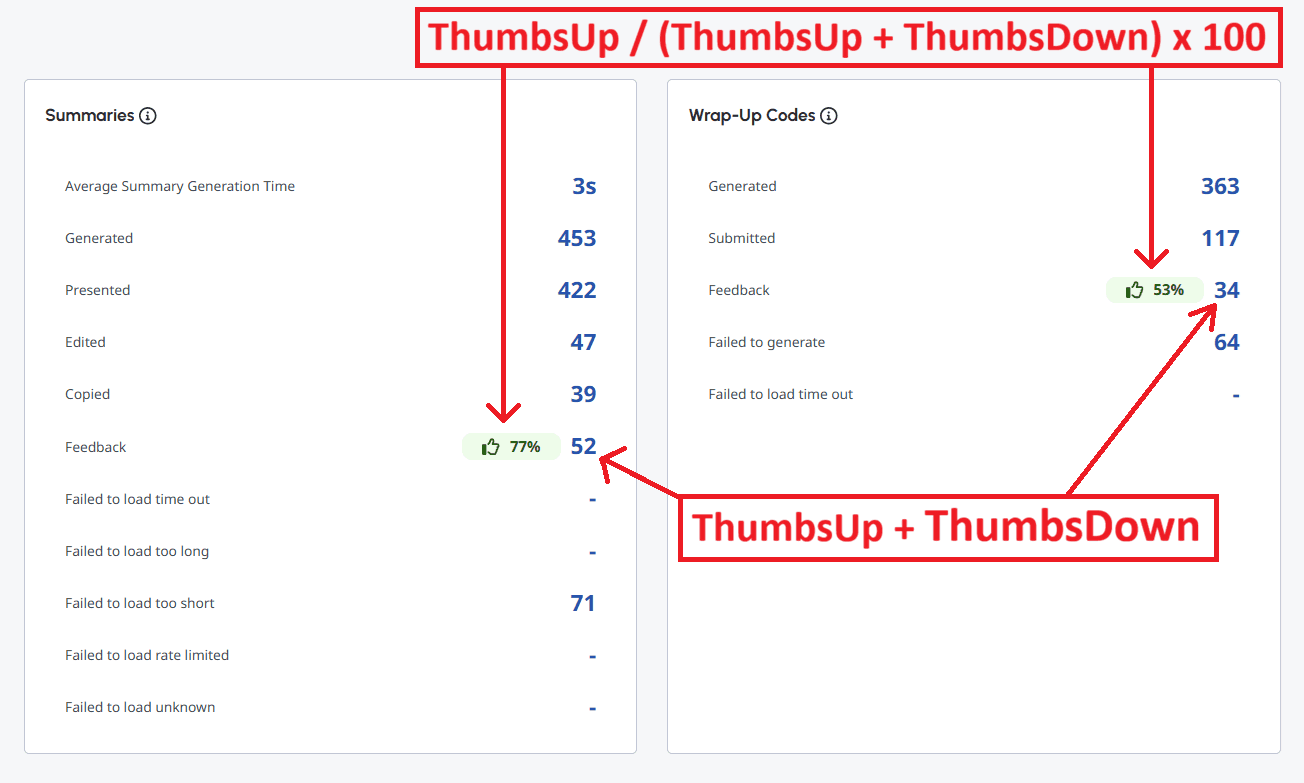
For both Summaries and Wrap-Up Codes, the Feedback metric defines the total number of thumbs-up and thumbs-down responses. To calculate the percentage of positive feedback (thumbs-up), Genesys Cloud divides the number of thumbs-up responses by the total number of thumbs-up and thumbs-down responses and then multiplies the result by 100.
Positive feedback (%) = (ThumbsUp / (ThumsUp + ThumbsDown) × 100
You can use the Summary Analytics Aggregate API to query more KPIs. For more information, see Summary Aggregate Query.
[NEXT] Was this article helpful?
Get user feedback about articles.